IL4216 Просмотр технического описания (PDF) - Infineon Technologies
Номер в каталоге
Компоненты Описание
производитель
IL4216 Datasheet PDF : 4 Pages
| |||
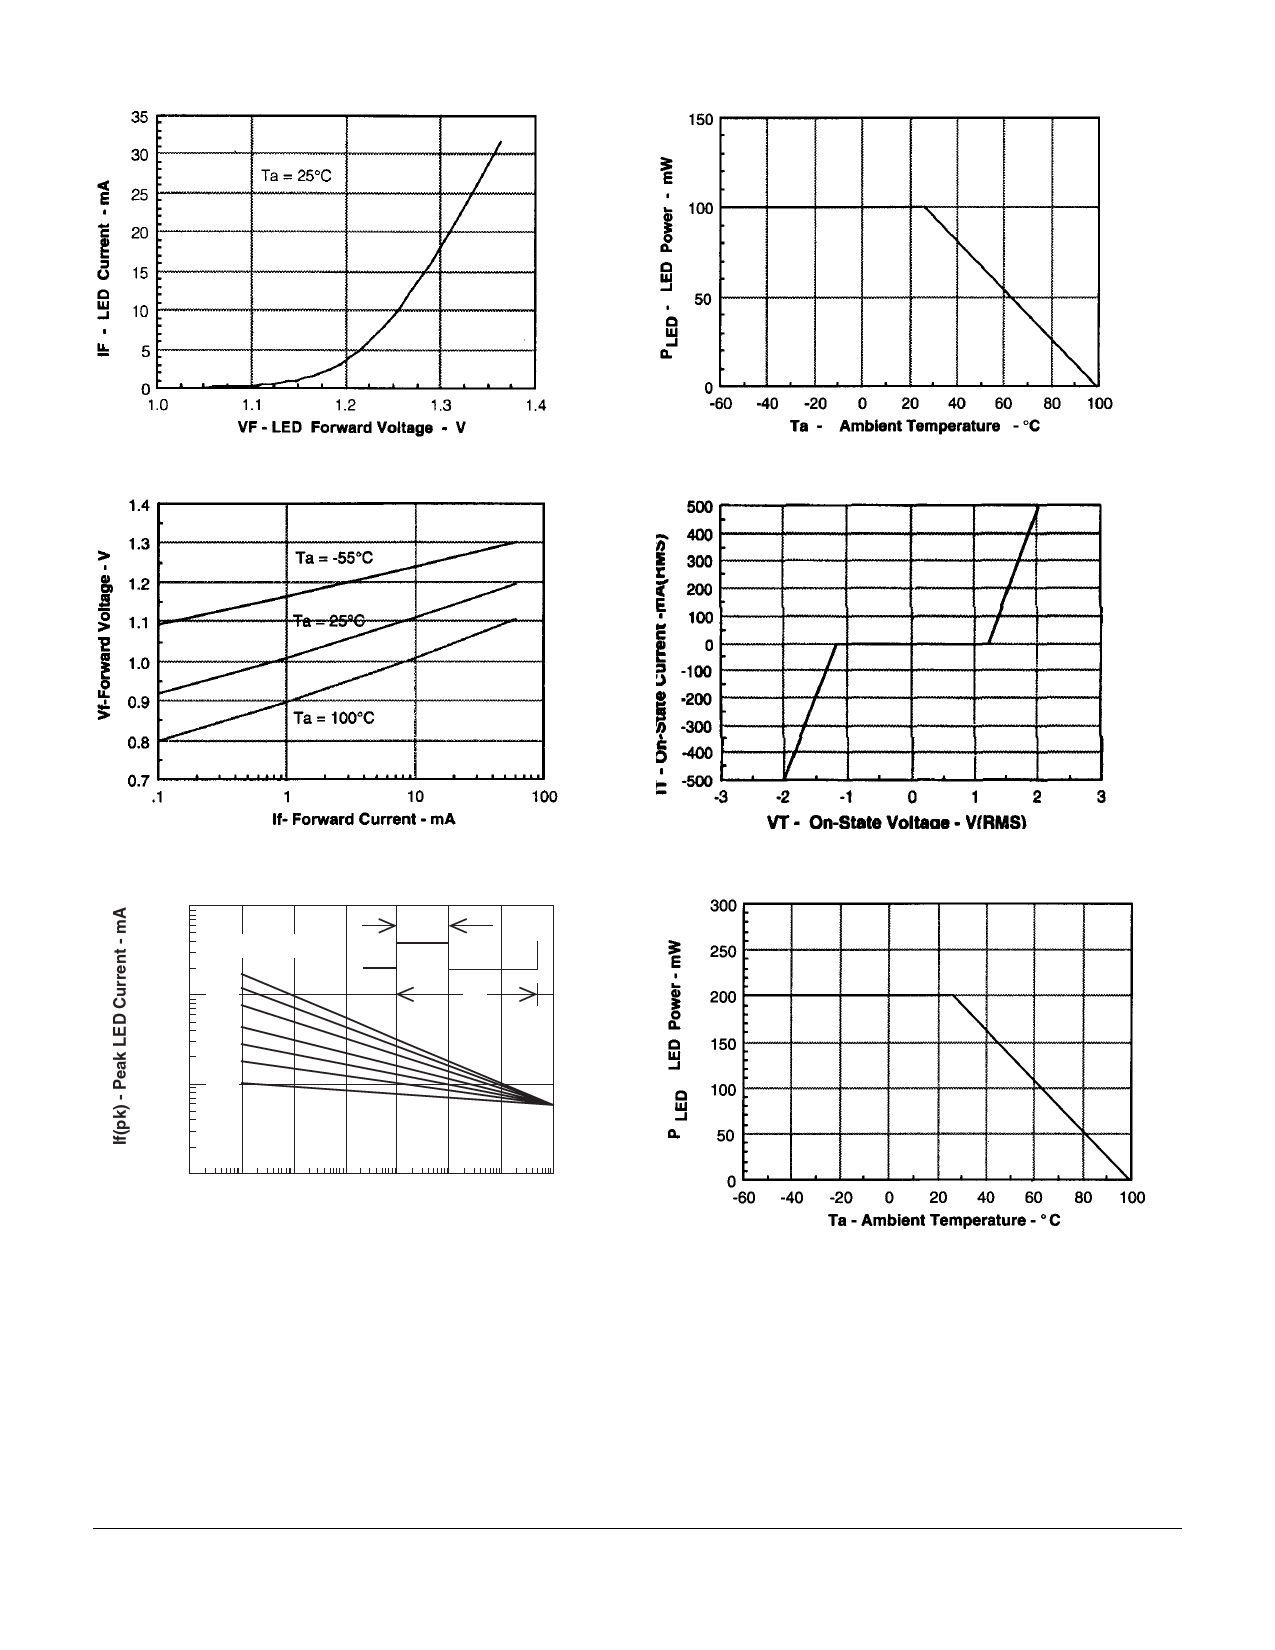
Figure 1. LED forward current vs. forward voltage
Figure 4. Maximum LED power dissipation
Figure 2. Forward voltage versus forward current
Figure 5. On-state terminal voltage vs. terminal current
Figure 3. Peak LED current vs. duty factor, Tau
10000
1000
100
Duty Factor
.005
.01
.02
.05
.1
.2
.5
τ
t
DF = τ/t
10
10-6 10-5 10-4 10-3 10-2 10-1 100 101
t - LED Pulse Duration - s
Figure 6. Maximum output power dissipation
2001 Infineon Technologies Corp. • Optoelectronics Division • San Jose, CA
www.infineon.com/opto • 1-888-Infineon (1-888-463-4636)
2–168
IL4216/4217/4218
March 17, 2000-12
Share Link: 