MGA-43024-BLKG Просмотр технического описания (PDF) - Avago Technologies
Номер в каталоге
Компоненты Описание
производитель
MGA-43024-BLKG Datasheet PDF : 18 Pages
| |||
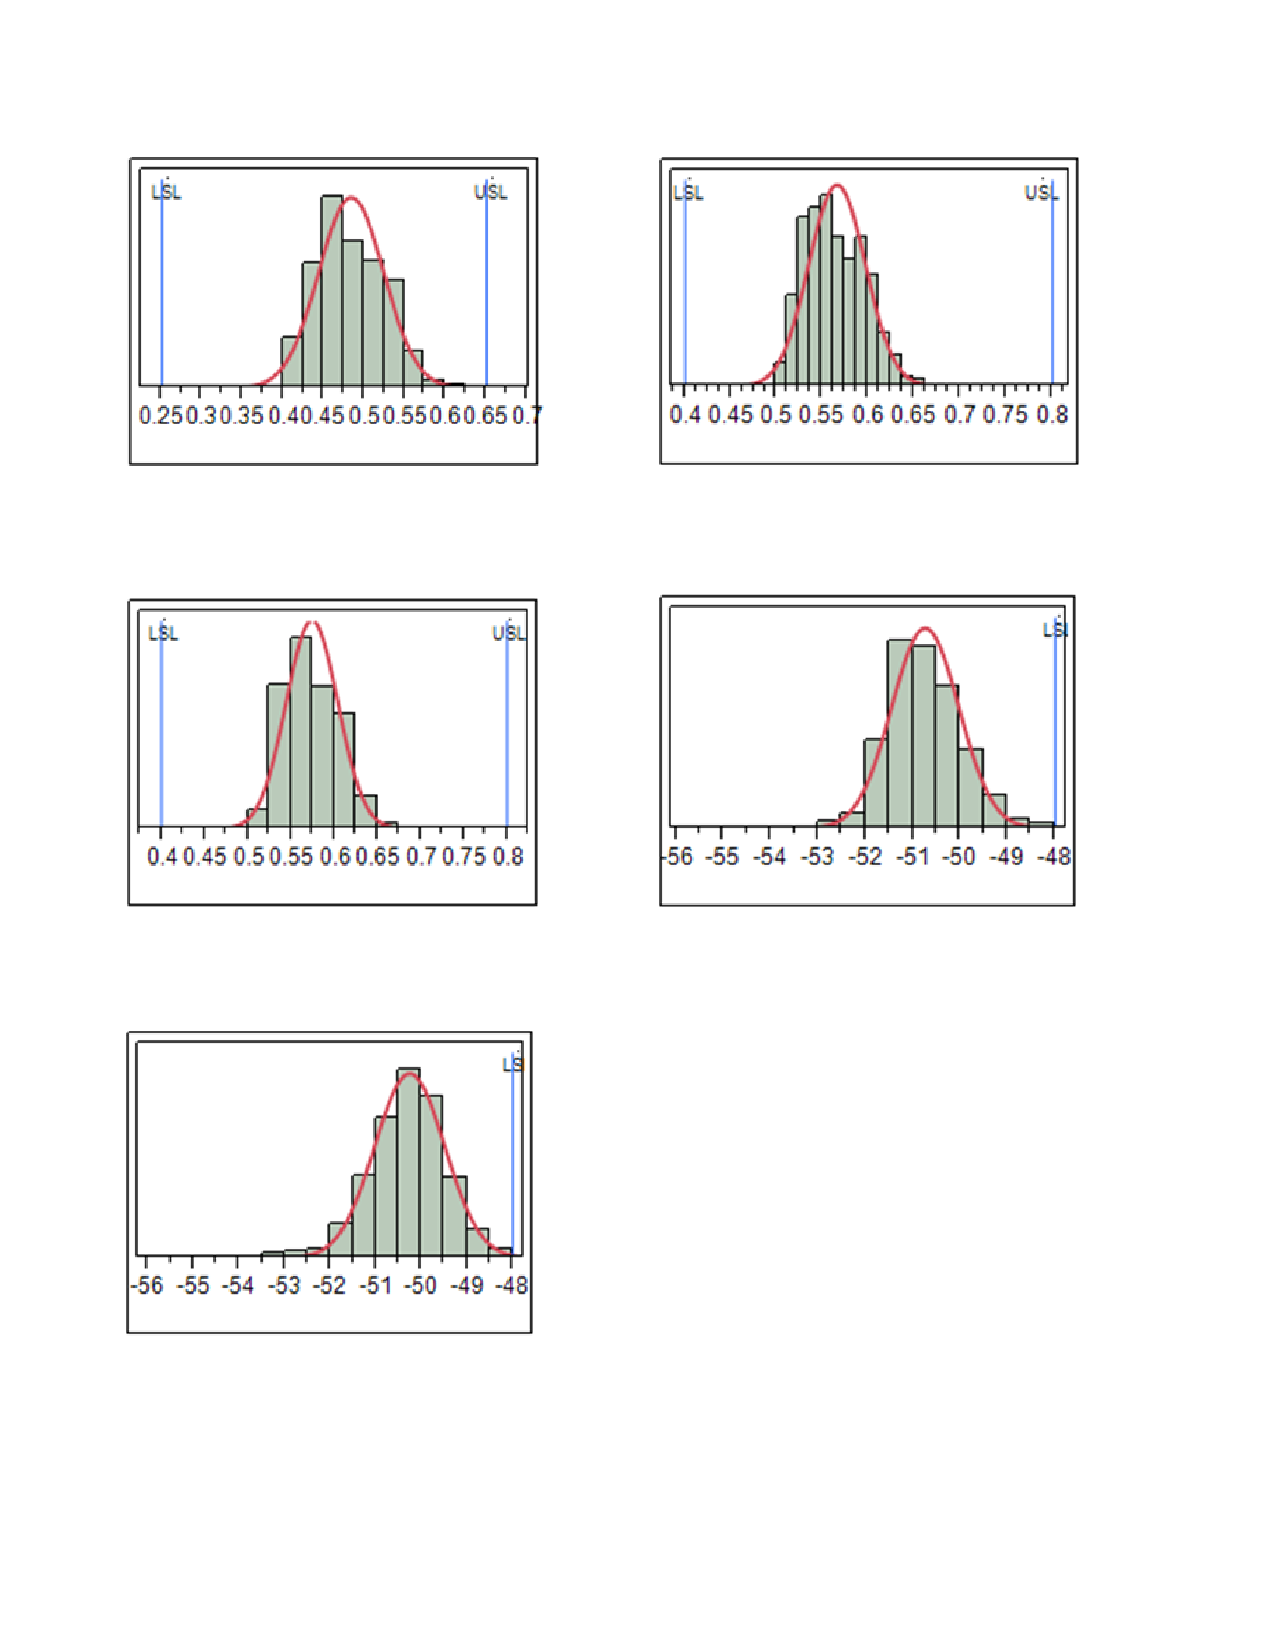
Product Consistency Distribution Charts [1]
Figure 1. Idq
Figure 2. Idd total @ 21 dBm at 2412 MHz
Figure 3. Idd total @ 21 dBm at 2462 MHz
Figure 4. RBE @ 21 dBm at 2390 MHz
Figure 5. RBE @ 21 dBm at 2483.5 MHz
Note:
1. Distribution data sample size is 1200 samples taken from three wafer lots. TA = 25 °C, Vdd = VddBias = 5.0 V, Vc1 = 2.0 V, Vc2 = 2.2 V, Vc3 = 2.0 V, RF input
at 2412 MHz and 2462 MHz, unless otherwise stated. Future wafers allocated to this product may have nominal values anywhere between the
upper and lower limits.
3
Share Link: 