L5150GJTR Просмотр технического описания (PDF) - STMicroelectronics
Номер в каталоге
Компоненты Описание
производитель
L5150GJTR Datasheet PDF : 29 Pages
| |||
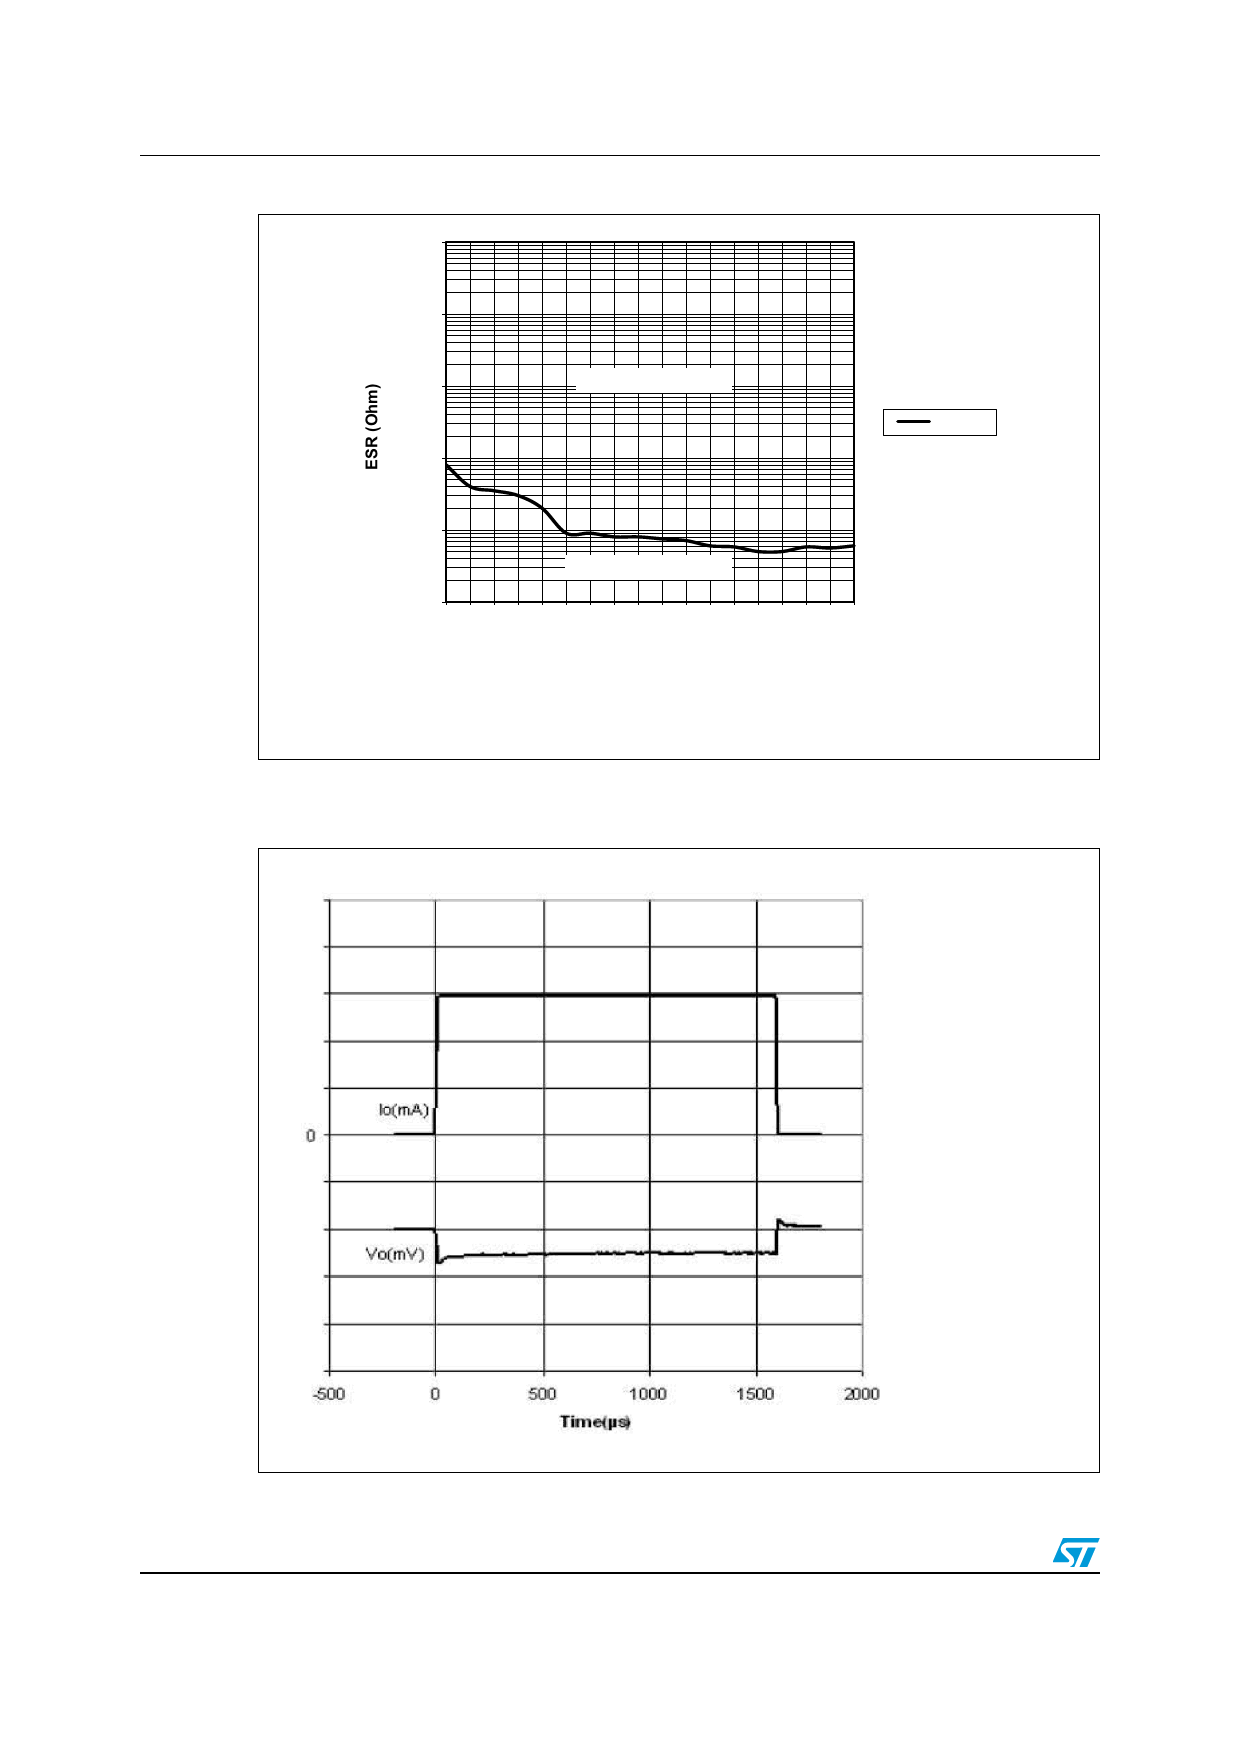
Application information
Figure 25. Stability region
L5150GJ
67$%,/,7<5(*,21
(65PLQ
817(67('5(*,21
&R
)
*$3*36
Note: The curve which describes the minimum ESR is derived from characterization data on the regulator
with connected ceramic capacitors which feature low ESR values (at 100 kHz). Any capacitor with
further lower ESR than the given plot value must be evaluated in each and every case.
?
Figure 26. Maximum load variation response
Vo = 50 mV/div
Io = 50 mA/div
VS = 13.5 V
Io = 8 to 150 mA
Tc = 25 °C
Co = 220 nF
16/29
Doc ID 15540 Rev. 12
Share Link: 