ADXL330 Просмотр технического описания (PDF) - Analog Devices
Номер в каталоге
Компоненты Описание
производитель
ADXL330 Datasheet PDF : 16 Pages
| |||
ADXL330
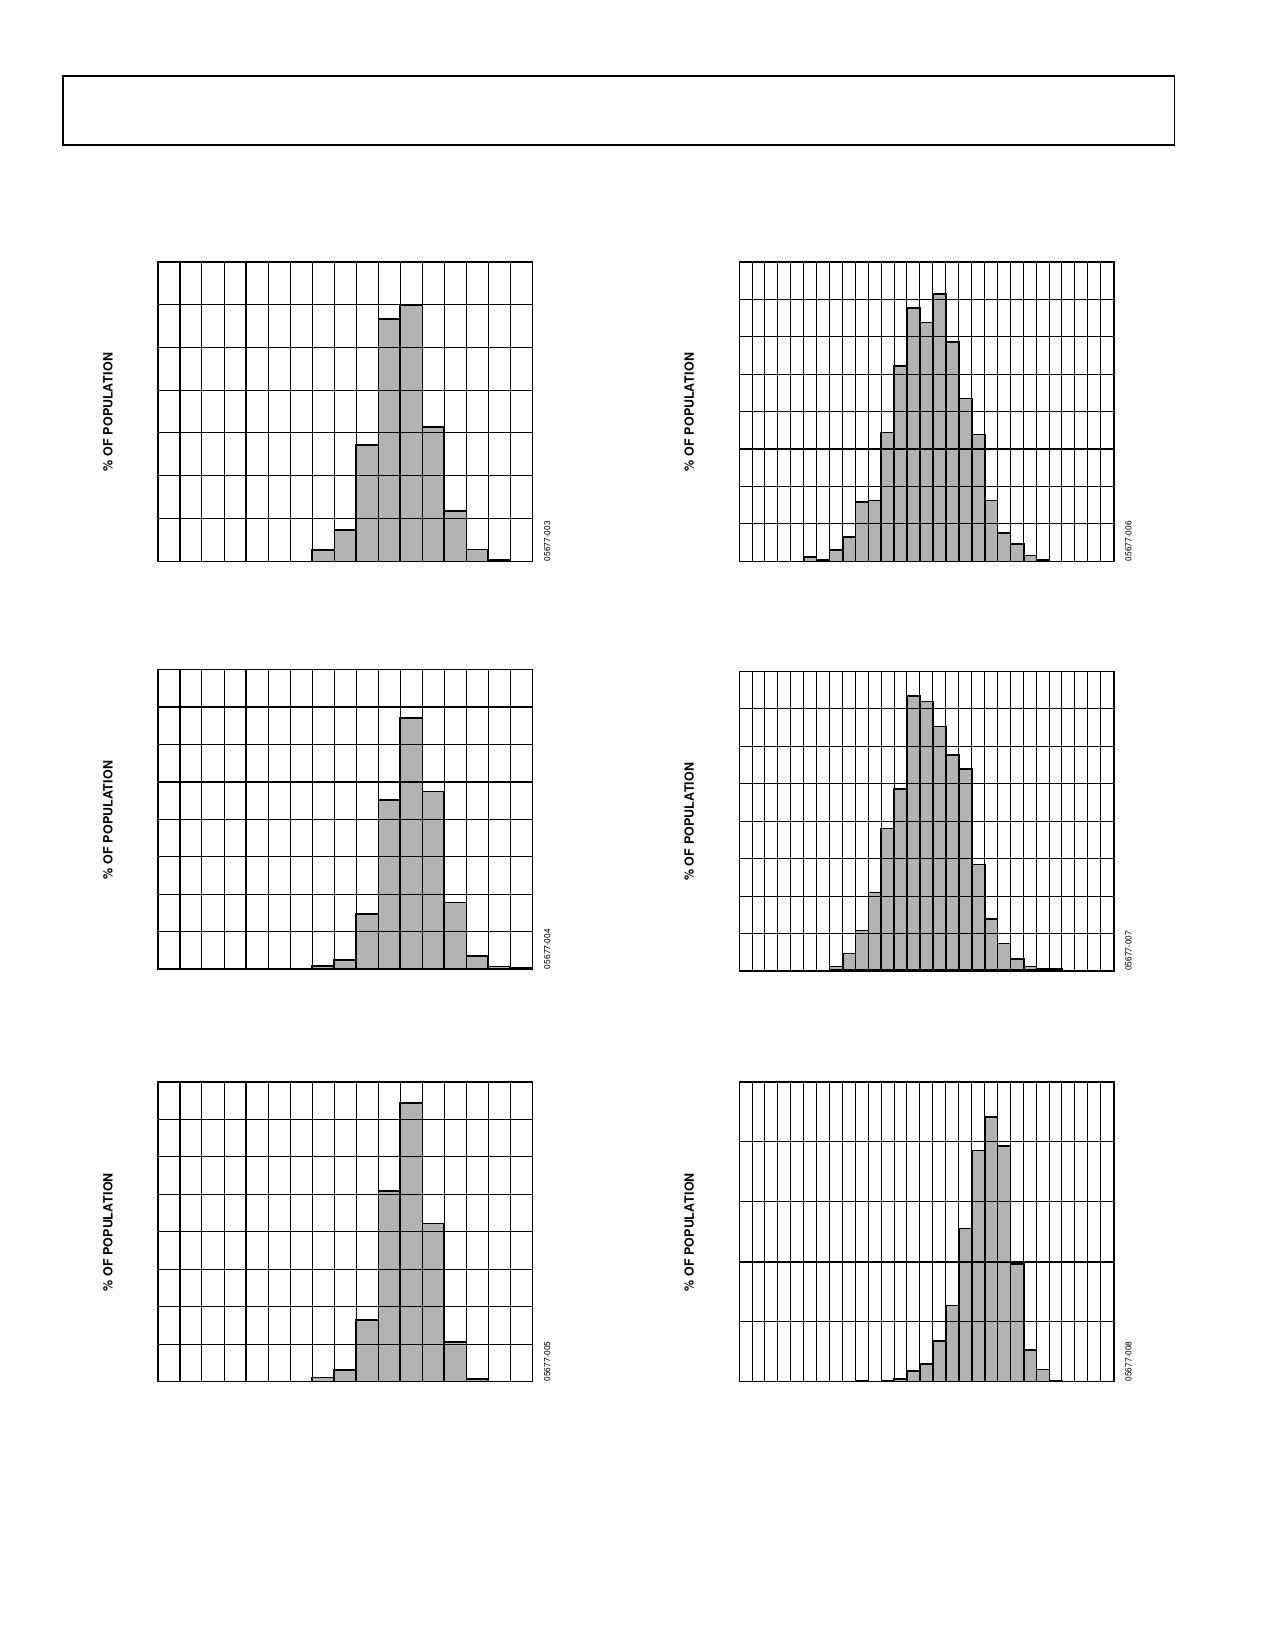
TYPICAL PERFORMANCE CHARACTERISTICS
N > 1000 for all typical performance plots, unless otherwise noted.
35
30
25
20
15
10
5
0
1.42 1.44 1.46 1.48 1.50 1.52 1.54 1.56 1.58
OUTPUT (V)
Figure 5. X-Axis Zero g Bias at 25°C, VS = 3 V
40
35
30
25
20
15
10
5
0
1.42 1.44 1.46 1.48 1.50 1.52 1.54 1.56 1.58
OUTPUT (V)
Figure 6. Y-Axis Zero g Bias at 25°C, VS = 3 V
40
35
30
25
20
15
10
5
0
1.42 1.44 1.46 1.48 1.50 1.52 1.54 1.56 1.58
OUTPUT (V)
Figure 7. Z-Axis Zero g Bias at 25°C, VS = 3 V
16
14
12
10
8
6
4
2
0
0.95 0.96 0.97 0.98 0.99 1.00 1.01 1.02 1.03 1.04 1.05 1.06 1.07 1.08 1.09
OUTPUT (V)
Figure 8. X-Axis Zero g Bias at 25°C, VS = 2 V
16
14
12
10
8
6
4
2
0
0.95 0.96 0.97 0.98 0.99 1.00 1.01 1.02 1.03 1.04 1.05 1.06 1.07 1.08 1.09
OUTPUT (V)
Figure 9. Y-Axis Zero g Bias at 25°C, VS = 2 V
25
20
15
10
5
0
0.88 0.90 0.92 0.94 0.96 0.98 1.00 1.02 1.04 1.06 1.08 1.10 1.12 1.14 1.16
OUTPUT (V)
Figure 10. Z-Axis Zero g Bias at 25°C, VS = 2 V
Rev. A | Page 6 of 16
Share Link: 